
Quick answer
A professional infographic starts with one clear message and a small amount of accurate, sourced information. Pick a structure that fits the content (statistics, process, timeline, comparison), give it a strong headline and an obvious reading order, use the right chart for each number, keep to two fonts and a limited palette, and cite your sources at the bottom.
Infographics are popular because they let people grasp a topic in seconds. That only works when the design does the organizing: a clear point, a few well-chosen facts, and a layout that leads the eye. Most weak infographics fail for the opposite reason — too many facts, no hierarchy and decoration in place of meaning. Here's a step-by-step process.
In this article
1. Decide the one message
Write the takeaway as a sentence before you design anything: “Remote teams that write things down make faster decisions”, or “Five steps to a cheaper energy bill”. Everything on the page should support that sentence. If a fact doesn't, leave it out — or save it for a second infographic.
Think about who will read it and where: a printed handout, a slide, a LinkedIn post or a long scroll on a blog all need different sizes and amounts of detail.
2. Choose a structure
| Type | Use it for |
|---|---|
| Statistical | A handful of key numbers with short explanations |
| Process / how-to | Steps in order |
| Timeline | History, roadmaps, project phases |
| Comparison | Two or more options side by side |
| List | Tips, facts or resources on one theme |
| Hierarchy / pyramid | Levels of importance or structure |
| Funnel | Stages that narrow, like a sales funnel |
Many professional infographics combine two: a headline statistic, then a process. Our guide to organizing information visually helps you choose.
3. Get the data right
- Use reliable sources — official statistics, peer-reviewed research, your own measured data — and note each one.
- Check the date and context. A figure from one country or year may not apply elsewhere.
- Round sensibly. “About 1 in 4” is easier to read than 24.7%, when precision isn't the point.
- Pick honest charts: start bar charts at zero, use pie charts only for parts of one whole, and keep scales consistent.
| You want to show… | Chart |
|---|---|
| Comparison between categories | Bar or column chart |
| Change over time | Line chart |
| Parts of a whole (few parts) | Pie or donut chart |
| Progress toward a goal | Progress bar or gauge |
| Relationship between two measures | Scatter plot |
4. Lay it out for scanning
- 1Headline at the top, large, stating the message — not just the topic.
- 2Clear sections, each with a short heading, separated by space or subtle dividers.
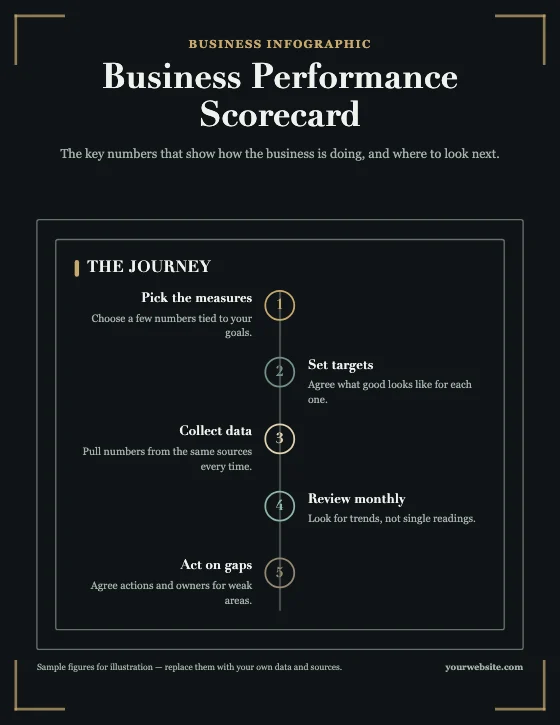
- 3One reading direction — usually top to bottom — with numbered steps where order matters.
- 4Big numbers, small explanations: the key figure is the largest thing in its section.
- 5Icons that add meaning, used consistently in one style.
- 6A footer with sources and, where relevant, your name or logo.

5. Keep the style disciplined
- Two fonts at most: one for headings, one for text.
- A limited palette: one or two main colours plus a neutral, with one accent for emphasis.
- Contrast for readability: body text should meet at least a 4.5:1 contrast ratio with its background (WCAG AA).
- White space: crowded infographics look amateur. Remove before you shrink.
More in our article on the principles of good visual design.
6. Size and export for where it'll be seen
| Where | Typical size |
|---|---|
| Print handout | A4 or US Letter, portrait |
| Blog or website | A tall, narrow page — around 800–1,080 px wide |
| Instagram feed | 1080 × 1350 px (4:5) or 1080 × 1080 px |
| Presentation slide | 1920 × 1080 px (16:9) |
Export PNG for crisp text on screens, JPG for smaller files with photos, and PDF for print or sharing as a document.
Try the free Infographic MakerStart from a template, edit the text and chart data, and download PNG, JPG or PDF.Frequently asked questions
What makes an infographic look professional?
One clear message, a strong headline, a logical reading order, accurate and sourced data, consistent icons, two fonts at most, a limited colour palette and plenty of white space.
How much text should an infographic have?
As little as possible: short headings, key numbers and one-line explanations. If a section needs a paragraph to make sense, it may belong in an article instead.
Do I need to cite sources on an infographic?
Yes. List your sources in the footer so readers can check figures, especially if the infographic will be shared.
What is the best size for an infographic?
It depends on where it's used: A4 or Letter for print, a tall page around 800–1,080 px wide for blogs, 1080 × 1350 px for Instagram, and 1920 × 1080 px for slides.